



The public CVE program published 48,185 new vulnerabilities in 2025, a 20.6 percent year-over-year increase on top of the record 38 percent jump in 2024 (40,009 CVEs). Over the same window, the CISA Known Exploited Vulnerabilities catalog grew roughly 20 percent to 1,484 entries, Google's Threat Intelligence Group counted 90 zero-days exploited in the wild (with enterprise tech hitting an all-time high share at 48 percent), and Mandiant's M-Trends 2026 put the mean time to exploit at an estimated negative seven days, meaning exploitation routinely happens before a patch is even released. None of those numbers are theoretical: every figure links back to a named primary publisher and most are now corroborated across at least two independent reports.
Three forces are reshaping vulnerability management in 2026. First, the CVE pipeline has industrialized. The total number of CVE Numbering Authorities reached 484 by January 2026, with the Linux Kernel CNA alone publishing 4,325 records in 2024 (10.81 percent of the year's total) and GitHub adding another 2,121. The 2024 surge was not a one-time blip. CVE submissions grew +263 percent between 2020 and 2025, and Q1 2026 submissions are tracking ~33 percent higher than Q1 2025. Second, the National Vulnerability Database has stopped trying to enrich every CVE. NIST formally transitioned NVD to a triage model on April 15, 2026, reclassifying approximately 29,000 backlog CVEs as Not Scheduled and committing to enrich only the 15 to 20 percent of incoming CVEs that intersect KEV, federal-government software, or Executive Order 14028 critical-software lists. Third, time-to-exploit has compressed past the patch cycle. Mandiant and Verizon both show exploitation outrunning defenders: Mandiant's mean time to exploit dropped to negative seven days in 2025, and the Verizon 2026 Data Breach Investigations Report made vulnerability exploitation the most common initial access vector for breaches, at 31 percent of known initial access vectors in non-Error, non-Misuse breaches, up from 20 percent in the previous edition.
This post is the Stingrai research team's canonical 2026 reference for CVE and exploitation activity. It assembles 100-plus numeric claims from named primary publishers including NVD / NIST, CISA KEV, CVE.org, Mandiant M-Trends 2026, Google GTIG / Project Zero, the Verizon 2026 DBIR, IBM X-Force 2026 and the IBM Cost of a Data Breach Report 2026, the Microsoft Digital Defense Report 2025 plus Patch Tuesday tallies, CrowdStrike 2026 Global Threat Report, Sonatype State of the Software Supply Chain 2026, the Synopsys Open Source Security and Risk Analysis Report, Veracode State of Software Security 2025, Trend Micro Zero Day Initiative, FIRST EPSS, VulnCheck, GreyNoise, and HackerOne. Lead data is full-year 2025 telemetry as reported in each publisher's 2026 annual edition, the freshest available as of August 21, 2026. Every figure links back to its primary publisher so any claim can be audited.
TL;DR: 13 labeled key stats
CVEs published in 2025: 48,185 (+20.6% YoY) (JerryGamblin 2025 CVE Data Review).
2025 CVE severity split: 3,984 Critical / 15,003 High / 25,551 Medium / 1,557 Low (JerryGamblin).
Cumulative CVEs since 1999 (end-2025): 308,920 (JerryGamblin).
CISA KEV catalog total at end-2025: 1,484 (+245 added in 2025, +20% YoY) (SecurityWeek).
KEV ransomware-flagged 2025 additions: 24 (SecurityWeek).
Microsoft KEV share: 350 vulns (~24% of catalog) (Cybersecurity News).
Google GTIG zero-days exploited in the wild, 2025: 90 (Google Cloud blog).
Enterprise share of 2025 zero-days: 48% (43 of 90, all-time high) (Google Cloud blog).
Mandiant 2026 mean time to exploit: estimated -7 days (Mandiant M-Trends 2026).
Mandiant 2025 initial-access-broker handoff time: 22 seconds (Mandiant M-Trends 2026).
Vulnerability exploitation as an initial access vector (Verizon 2026 Data Breach Investigations Report): 31% of known initial access vectors in non-Error, non-Misuse breaches, now the most common, up from 20% in the previous edition (Verizon 2026 Data Breach Investigations Report).
NVD post-April-2026 estimated enrichment coverage: 15-20% of incoming CVEs (CSA research note).
Key takeaways
The CVE pipeline is no longer a useful queue, it is a firehose. 48,185 records published in 2025, 484 CNAs, and the Linux Kernel CNA alone matching the entire annual volume of the early 2010s. Vulnerability programs that triage by NVD CVSS will miss roughly a third of the year's exploited-in-the-wild bugs because NVD is no longer scoring most of them. Triage now starts with CISA KEV plus EPSS, not NVD.
The KEV catalog is the operational signal that matters. 1,484 entries, ~24 percent are Microsoft, and 19 of the 59 KEV entries whose ransomware flag was flipped during 2025 target network-security appliances (Ivanti, Fortinet, Citrix, Palo Alto, Zimbra). Those are exactly the boxes deployed to protect the perimeter. If you patch nothing else, patch your edge.
Time-to-exploit has crossed zero. Mandiant's mean time to exploit is estimated at -7 days for 2025, meaning exploitation routinely beats the patch. CrowdStrike measures eCrime breakout time at 29 minutes (fastest 27 seconds) and data exfiltration starting within 4 minutes of initial access. The patch cycle is no longer a defensive primitive on its own.
Enterprise tech is now the primary zero-day target. Google GTIG's 2025 review records 90 zero-days exploited in the wild, with 43 (48%) targeting enterprise technologies, the highest enterprise share ever recorded. Microsoft (25), Google (11), Apple (8), and Cisco (4) led vendor counts.
NIST has formally given up on enriching the long tail. As of April 15, 2026 NVD operates as a triage queue, with ~29,000 legacy CVEs marked Not Scheduled and only an estimated 15 to 20 percent of new CVEs receiving full enrichment. Vulnerability programs that depend on NVD CPE matching alone are blind to ~80 percent of the population. VulnCheck's analysis of 2024 CVE data found NVD CPE coverage was already only 41 percent.
Defenders are patching slower while exploitation accelerates. Verizon's 2026 DBIR puts the median time to fully remediate a critical vulnerability at 43 days, up from 32 the year before, and found only 26 percent of CISA KEV entries fully remediated, down from 38 percent. The median organization had 50 percent more critical vulnerabilities to fix than a year earlier. The gap between "known exploited" and "actually patched" is widening, which is why detection has to carry load the patch cycle cannot.
Methodology
Date cutoff: August 21, 2026. Lead data is full-year 2025 telemetry as reported in each publisher's 2026 annual edition; figures labeled "2026" are first-quarter, running-year, or projection numbers from named publishers. Statistics that could not be reached via a named primary source on at least one verification pass were dropped rather than estimated. Where multiple primary publishers report compatible figures we cite the publisher whose methodology window matches the claim. Secondary sources are used only where they constitute a public record of a CVE event (corporate disclosure, KEV addition, ZDI advisory).
Sources span: NIST National Vulnerability Database; CVE.org / MITRE; CISA Known Exploited Vulnerabilities Catalog; Mandiant M-Trends 2026 (more than 500,000 hours of incident response data); Google Threat Intelligence Group / Project Zero 2024 and 2025 zero-day reviews; Verizon 2026 DBIR (more than 31,000 incidents and over 22,000 confirmed breaches across 145 countries); IBM X-Force 2026 and the IBM Cost of a Data Breach Report 2026; the Microsoft Digital Defense Report 2025 and Microsoft Patch Tuesday tallies; CrowdStrike 2026 Global Threat Report; Sonatype State of the Software Supply Chain 2026; Synopsys Open Source Security and Risk Analysis Report; Veracode State of Software Security 2025; Trend Micro Zero Day Initiative (Pwn2Own); FIRST EPSS v4 release; VulnCheck NVD++; GreyNoise mass-exploitation telemetry; HackerOne 9th Annual Hacker-Powered Security Report; and named CVE advisories from Citrix, Ivanti, Cleo, F5, Broadcom / VMware, and Microsoft Security Response Center.
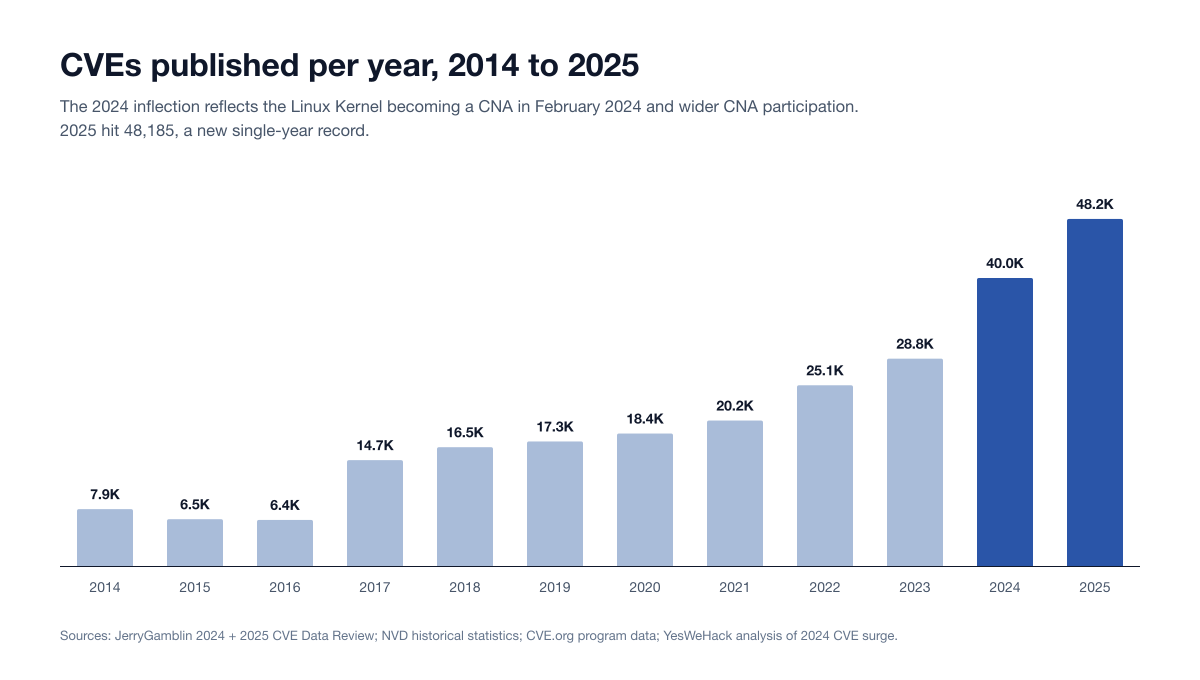
Figure 1: CVE publication volume per year, 2014 to 2025. The 2024 inflection (40,009 CVEs, +38% YoY) reflects the Linux Kernel becoming a CNA in February 2024 and the broader expansion of CNA participation. Sources: JerryGamblin.com 2024 review; JerryGamblin.com 2025 review; NVD historical statistics.
How many CVEs were published in 2025?
48,185 CVEs were published in 2025, a 20.6 percent increase on 2024 and a single-year record. Cumulative CVE volume since 1999 reached 308,920 by December 31, 2025, which means roughly one in six of every CVE ever published landed in 2025 alone. Those totals come from JerryGamblin's 2025 CVE Data Review, the longest-running independent count of the full published CVE corpus. For scale, the NVD itself held 381,619 CVE records in total as of August 2026.
2025 CVE severity distribution
The 2025 corpus skews Medium. Critical and High together account for 39.4 percent of the year, while Medium alone is more than half of it:
CVSS severity | 2025 CVEs | Share of 2025 CVEs |
|---|---|---|
Critical (9.0-10.0) | 3,984 | 8.3% |
High (7.0-8.9) | 15,003 | 31.1% |
Medium (4.0-6.9) | 25,551 | 53.0% |
Low (0.1-3.9) | 1,557 | 3.2% |
Critical + High combined | 18,987 | 39.4% |
The four buckets cover 46,095 of the year's 48,185 records; the balance is not assigned to a severity bucket in the source dataset. The mean CVSS base score for 2025 was 6.60 and the median 6.50, per JerryGamblin. Both sit below 2024 (mean 7.1) and 2023 (mean 7.7). The decline is a composition effect rather than a safety improvement: Critical volume held roughly flat while Medium-severity volume ballooned.
Why an NVD query returns an incomplete 2025 severity split
Pulling a 2025 severity distribution straight from NVD undercounts, because NVD did not enrich most of the year. VulnCheck found that roughly 10,000 CVE-2025 records carried no CVSS score and only about 32 percent had been fully enriched by April 2026, and JerryGamblin's review puts CPE identifier coverage for the 2025 corpus at 57.6 percent. For a complete 2025 severity split, use a full-corpus independent count or a commercial enrichment feed rather than an NVD query. The April 2026 NVD triage reset described below makes that gap permanent from 2026 onward. The 2026 running publication count is tracked separately in the next section.
How big is the CVE pipeline in 2026?
Three datasets anchor the answer.
Annual CVE publication volume
JerryGamblin's 2025 CVE Data Review, the longest-running independent count of CVE publication, recorded 48,185 CVEs published in 2025, a 20.6 percent increase on 2024's 39,962 (the upstream JerryGamblin number; CVE.org figures cited at 40,009 elsewhere reconcile within the same window). The cumulative tally since 1999 reached 308,920 by year-end. December 2025 was the highest-volume month at 5,500 CVEs, more than 11 percent of the year's total in a single month. The trajectory: roughly 7,938 in 2014, ~16,500 in 2018, ~20,000 in 2021, 28,818 in 2023, 40,009 in 2024, 48,185 in 2025.
CNA participation
The number of CVE Numbering Authorities crossed 484 organizations on January 1, 2026, per the public CNA-distribution tracker maintained by Scott Moore. Of those, 142 disclosed zero CVEs in 2025; the working core is roughly 340 CNAs that contribute records in any given year. The single biggest 2024 contributor was Patchstack, a WordPress-plugin CNA, with 4,566 CVEs (11.41 percent of the total). The Linux Kernel CNA, founded in mid-February 2024, followed with 4,325 (10.81 percent), ahead of Wordfence (3,525), VulDB (2,936) and GitHub (2,121). Together the top five accounted for 17,473 CVEs (43.67 percent of the 2024 total).
In 2025 the CNA leaderboard shifted. Patchstack (7,007), VulDB (5,902), the Linux Kernel CNA (5,686), MITRE (5,208) and Wordfence (3,451) were the five highest-volume CNAs, per JerryGamblin's 2025 CVE Data Review. CNA counts and rankings are tracked publicly in Scott Moore's CNA distribution tracker, and the 2024 surge breakdown comes from YesWeHack's analysis of the record jump.
Submission growth and Q1 2026 outlook
NIST's April 2026 update records CVE submission growth of +263 percent between 2020 and 2025. Q1 2026 submissions are tracking roughly one-third higher than Q1 2025, putting the program on pace for another record year. None of this is a sign of a worsening security landscape on its own; it is largely a sign that more CNAs are reporting more bugs more thoroughly. But the volume has saturated downstream consumers, and that is what the NVD reform is trying to triage.
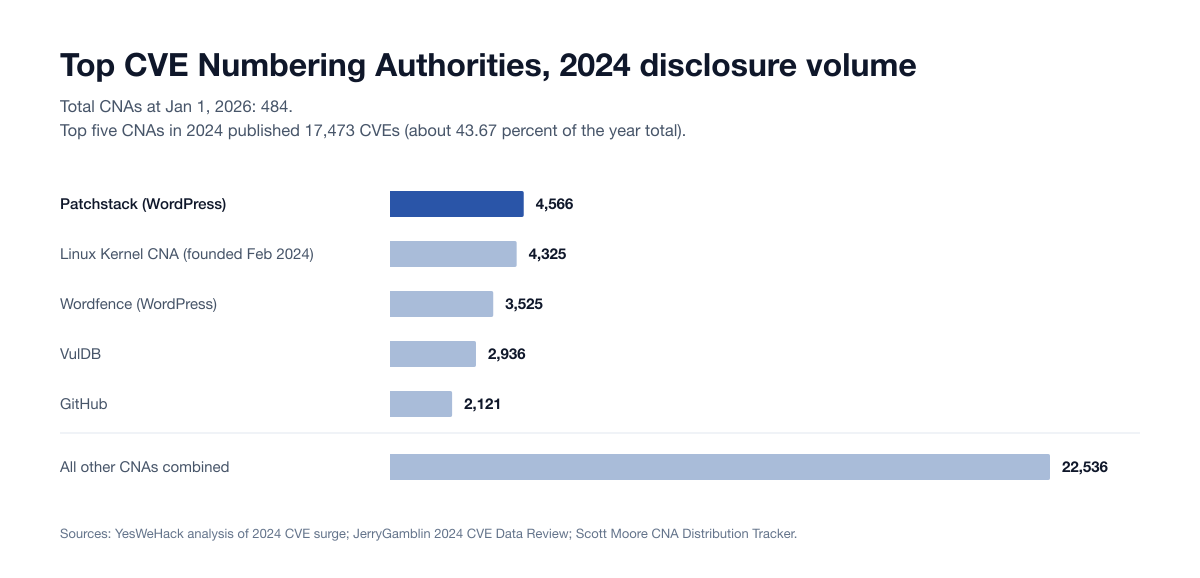
Figure 2: Top CVE Numbering Authorities by 2024 disclosure volume. The Linux Kernel CNA, founded mid-February 2024, immediately became the second-largest CNA, behind Patchstack. Sources: YesWeHack analysis of 2024 CVE surge; JerryGamblin.com 2024 review; Scott Moore CNA Distribution Tracker.
The NVD analysis backlog and the April 2026 reset
Starting in early 2024, NVD developed a significant backlog of unenriched CVEs and was unable to clear it. Three forces collided: a 12 percent NIST budget cut, a CISA pause of its $3.7M annual NVD funding in late 2023, and the +263 percent submission surge described above. By the end of 2025 the unprocessed backlog exceeded 27,000 records. Both the budget reduction and the funding withdrawal are documented in MIT Technology Review's account of the NVD breakdown.
NIST's response, formalized on April 15, 2026, is a risk-based triage model:
Approximately 29,000 backlog CVEs with NVD publication dates earlier than March 1, 2026 are now classified Not Scheduled.
Going forward, NVD will prioritize CVEs that meet at least one of three criteria: (1) the CVE is in the CISA KEV catalog, (2) the affected software is used within the federal government, or (3) the affected software is "critical software" under Executive Order 14028.
This is estimated to be 15 to 20 percent of incoming CVE volume.
NIST enriched ~42,000 CVEs in 2025 already (a 45 percent productivity gain), but submissions still outpaced output.
VulnCheck's analysis of CVE-2025 records found that approximately 10,000 had no CVSS score and only about 32 percent had been fully enriched by April 2026. Their separate analysis of the 2024 corpus found that NVD provided CPE identifiers for only 41.35 percent of published vulnerabilities, while VulnCheck's NVD++ enrichment service covered 76.95 percent of the same population. The practical implication: CPE-keyed asset matching against NVD will miss the majority of CVEs, regardless of whether they are Critical, High, or actively exploited. Enterprise vulnerability programs need either commercial enrichment, vendor advisories, or a KEV-first triage discipline.
CVSS severity trend: critical holds steady, medium keeps bloating
Per the Vulnerability Blog 2024 review of NVD severity data, the 2024 CVSS distribution was approximately:
CVSS severity | 2024 share |
|---|---|
Critical (9.0-10.0) | 14% |
High (7.0-8.9) | 34% |
Medium (4.0-6.9) | 50% |
Low (0.1-3.9) | 2% |
Volume of Critical CVEs has remained relatively consistent across 2022 through 2025; the share is dropping as Medium-severity volumes balloon. The 2024 average CVSS score was 7.1, a drop from 7.7 in 2023. This matters because (a) Critical-only triage misses material exploited bugs (multiple 2025 KEV adds were CVSS 7.x or 8.x), and (b) Medium-severity-and-below volume is precisely where the NVD analysis backlog now lives. The 2024 and 2023 averages are from the Vulnerability Blog 2024 review; the 2025 mean fell further to 6.60 with a median of 6.50, per JerryGamblin's 2025 CVE Data Review.
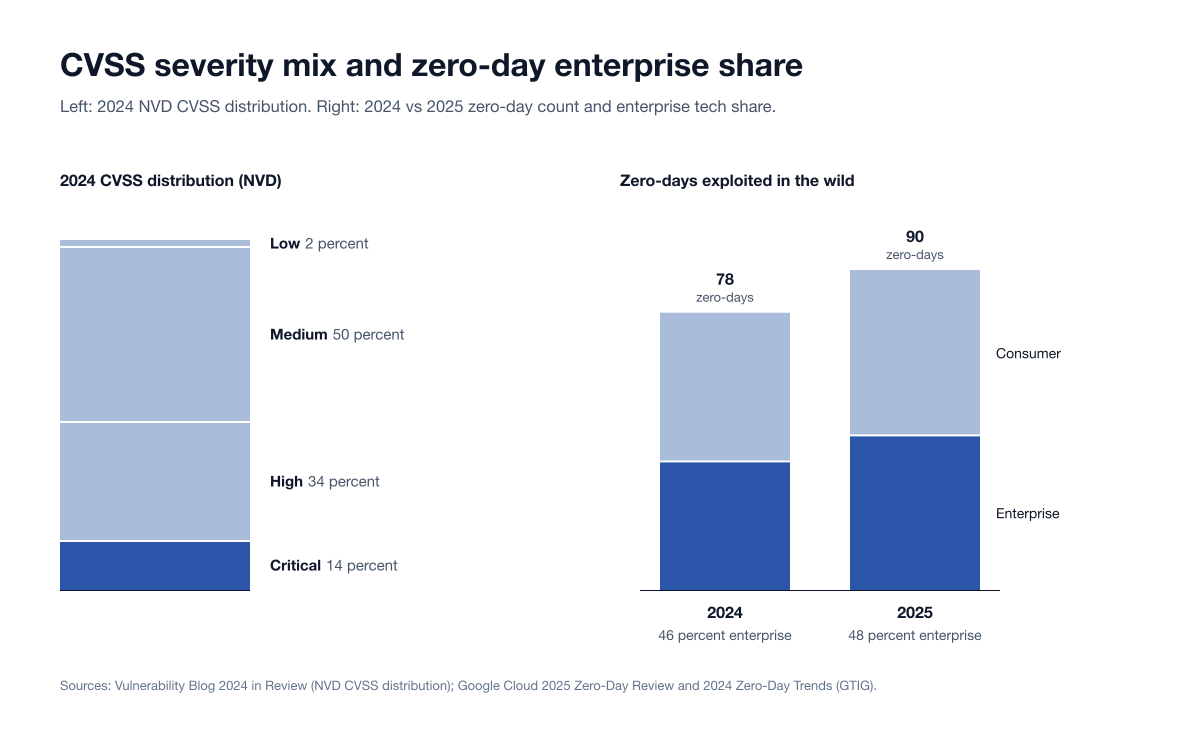
Figure 3: Left: CVSS v3 severity distribution among NVD-reviewed 2024 CVEs. Right: zero-day enterprise vs consumer share, 2024 vs 2025. Sources: Vulnerability Blog 2024 in review; Google Cloud zero-day 2025 review.
CISA KEV: the operational signal of 2026
The CISA Known Exploited Vulnerabilities Catalog became, in 2025, the de facto first-tier triage list for vulnerability management programs. CISA only adds CVEs with reliable evidence of in-the-wild exploitation, which makes it a far higher-signal feed than CVSS-only NVD data.
Catalog scale and growth
Metric | Value | Source |
|---|---|---|
KEV total entries, end-2024 | 1,239 | SecurityWeek |
KEV total entries, end-2025 | 1,484 | SecurityWeek |
KEV 2025 additions | 245 | SecurityWeek |
KEV YoY growth 2024 to 2025 | +20% | SecurityWeek |
KEV 2025 ransomware-tagged additions | 24 | SecurityWeek |
KEV growth in 2025 was roughly 30 percent above the 2023 to 2024 trend, per Cyble's analysis of the catalog updates.
Vendor distribution at end-2025
Cybersecurity News breakdown of the catalog by vendor:
Vendor | KEV entries | Share of catalog |
|---|---|---|
Microsoft | 350 | ~24% |
Apple | 86 | 5.8% |
Cisco | 82 | 5.5% |
Adobe | 76 | 5.1% |
67 | 4.5% |
Microsoft Windows alone accounts for 159 product-specific KEV entries, Chromium V8 for 37, Internet Explorer for 34, and various Microsoft Office products for additional volume. Microsoft also leads ransomware-flagged KEV entries with 100, followed by Fortinet (13), Ivanti (12), and Oracle (11). Product-level and ransomware-flag counts are from the Cybersecurity News KEV vendor breakdown.
Most important pattern: edge devices
Of the 59 KEV entries whose ransomware flag was flipped during 2025, 19 target network security appliances: VPNs, firewalls, gateway proxies, the Citrix and Ivanti and Fortinet and Palo Alto and Zimbra family of edge boxes that an enterprise typically buys to protect the perimeter. CL0P used CitrixBleed 2 (CVE-2025-5777) and Oracle E-Business Suite (CVE-2025-61882, CVE-2025-61884) to mass-exfiltrate; UNC5221 chained CVE-2025-0282 and then CVE-2025-22457 against Ivanti Connect Secure VPN appliances. Edge devices are the single hottest segment of the 2025 KEV catalog. Those silent flag flips were surfaced by GreyNoise's analysis of CISA's unpublicized KEV ransomware updates, which found the flipped entries led by Microsoft (16), Ivanti (6), Fortinet (5), Palo Alto Networks (3) and Zimbra (3). The CrowdStrike 2026 Global Threat Report corroborates the pattern from the attacker side: 40 percent of the vulnerabilities exploited by China-nexus adversaries targeted edge devices that typically lack comprehensive monitoring.
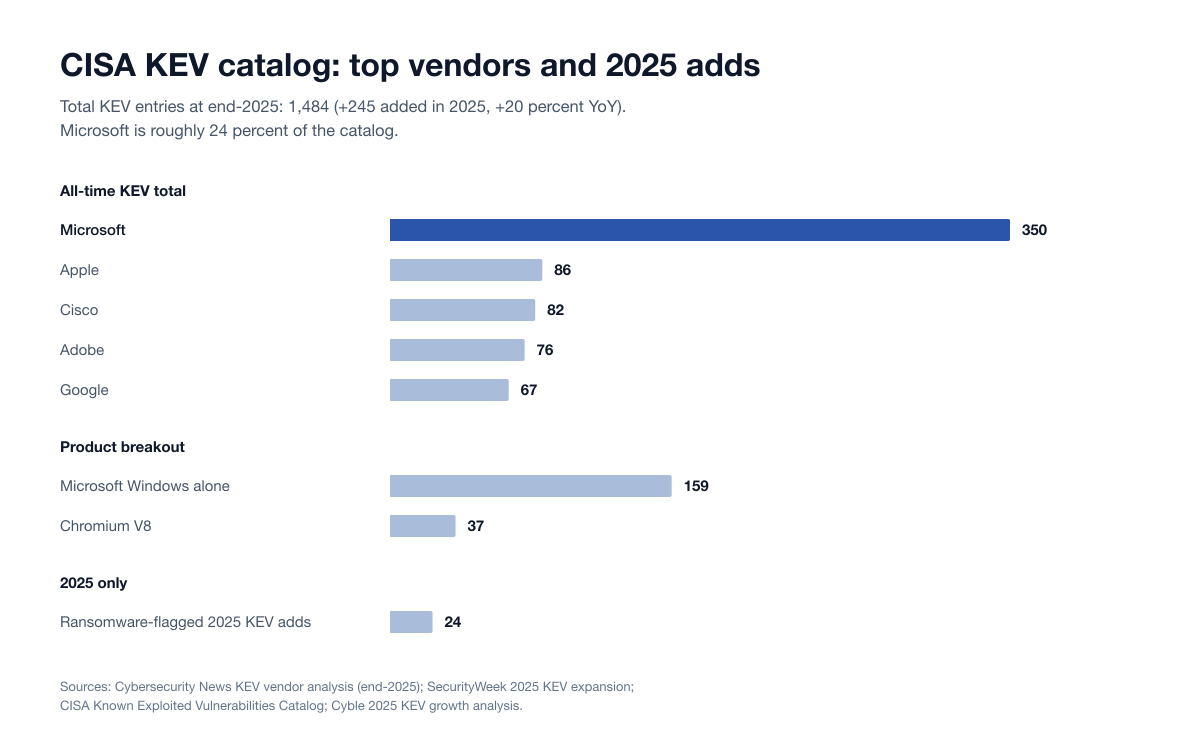
Figure 4: CISA Known Exploited Vulnerabilities catalog distribution by vendor at end of 2025. Microsoft accounts for ~24% of all entries. Sources: Cybersecurity News KEV vendor analysis; SecurityWeek KEV 2025 expansion; CISA KEV catalog.
Time-to-exploit: the patch cycle is no longer a defensive primitive
The most important shift in the 2025 to 2026 dataset is that exploitation routinely beats disclosure.
Mandiant M-Trends 2026
The M-Trends 2026 report, built on more than 500,000 hours of Mandiant incident response engagements, made three findings that should reshape every vulnerability-management runbook:
The mean time to exploit is approximately negative seven days. Across the population of vulnerabilities Mandiant observed being weaponized in 2025, exploitation began on average a week before the vendor patch was publicly available. This is not a single zero-day outlier; it is the mean across the dataset.
Exploits remain the leading initial-access vector for the sixth consecutive year. Many of the bugs used were exploited as zero-days, meaning attackers had working exploits before patches existed. M-Trends 2026 puts exploits at 32 percent of intrusions with a confirmed initial infection vector, ahead of voice phishing (11 percent) and prior compromise (10 percent).
The initial-access-broker handoff to a downstream ransomware affiliate now averages 22 seconds. This is the time between an IAB gaining persistent access to a victim network and a ransomware operator beginning encryption operations against that same network.
Median dwell time rose to 14 days in 2025, up from 11 days in 2024 and 10 days in 2023. The increase is concentrated in two long-tail categories: long-term espionage intrusions and North Korean IT-worker operations, both of which had a median dwell time of 122 days (about four months). For the rest of the population, dwell time has actually compressed. Both figures are from M-Trends 2026, which also records that 52 percent of intrusions were detected internally, up from 43 percent in 2024.
CrowdStrike 2026 Global Threat Report
CrowdStrike's 2026 Global Threat Report corroborates Mandiant on the speed metric:
Zero-days exploited before public disclosure, worded two ways. CrowdStrike's press release says "42% of vulnerabilities were exploited before public disclosure," while its findings blog reports "a 42% year-over-year increase in zero-days exploited prior to public disclosure." The full report is gated, so treat the 42 percent as CrowdStrike's figure without a settled base.
eCrime breakout time averaged 29 minutes, a 65 percent speed increase over 2024.
The fastest observed breakout was 27 seconds.
In one intrusion, data exfiltration began within 4 minutes of initial access.
AI-enabled adversary attacks rose 89 percent year-over-year, weaponizing AI across reconnaissance, credential theft, and evasion.
Google GTIG 2025 zero-day review
The Google Threat Intelligence Group's 2025 zero-day review tracked 90 zero-day vulnerabilities exploited in the wild in 2025. Multi-year context:
Year | Zero-days exploited in the wild |
|---|---|
2021 | 84 |
2022 | 63 |
2023 | 100 (record) |
2024 | 78 |
2025 | 90 |
The 2025 number is below the 2023 record but above 2024. The composition shift is what matters: enterprise technology accounted for 43 of the 90 zero-days (48 percent), an all-time high share. Microsoft led vendors with 25 zero-days, followed by Google (11), Apple (8), and Cisco (4). Operating systems, both mobile and desktop, were the single most-targeted category, climbing from 40 percent of all zero-days in 2024 to 44 percent in 2025.
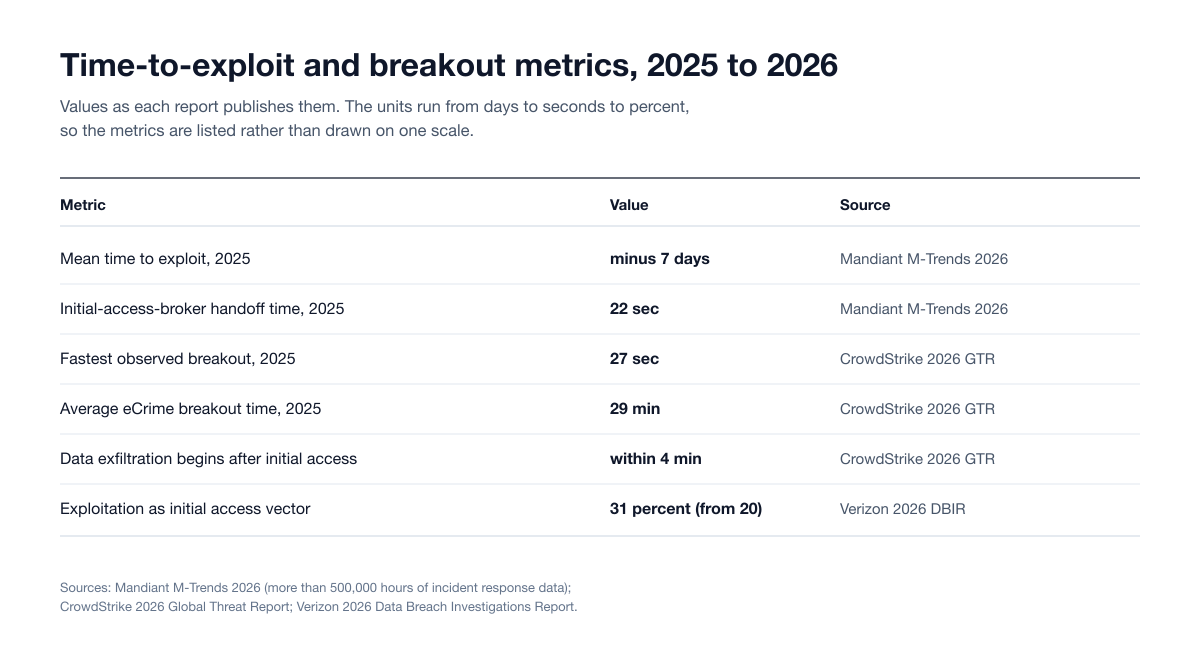
Figure 5: Time-to-exploit and breakout metrics across primary 2026 reports. Sources: Mandiant M-Trends 2026; CrowdStrike 2026 Global Threat Report; Google GTIG 2025 zero-day review.
Verizon 2026 Data Breach Investigations Report: exploitation is the top initial access vector
The 2026 Verizon DBIR, published May 19, 2026 and based on more than 31,000 security incidents and over 22,000 confirmed breaches across 145 countries, quantified two structural shifts:
Vulnerability exploitation is now the most common initial access vector for breaches, at 31 percent of known initial access vectors in non-Error, non-Misuse breaches, up from 20 percent in the previous edition. It overtook credential abuse, the previous leader, which fell to 13 percent. Median time to fully remediate a critical vulnerability rose to 43 days from 32, and only 26 percent of CISA KEV entries were fully remediated, down from 38 percent the year before.
Edge devices and VPNs went from 3 percent of breaches to 22 percent, a roughly 8x rise as an initial-access category in a single year, first measured in the 2025 DBIR. This is the same pattern visible in the KEV catalog, and the 2026 edition shows the median organization facing 50 percent more critical vulnerabilities to remediate than a year earlier.
The DBIR also confirmed that the human element drives 62 percent of breaches, up from 60 percent, ransomware is present in 48 percent, up from 44 percent, and third parties feature in 48 percent, a 60 percent year-over-year rise. AI did not invent new attack categories in 2025, but it accelerated existing ones, and exploited vulnerabilities accelerated alongside.
IBM X-Force: exploitation becomes the leading cause of attacks
The IBM X-Force Threat Intelligence Index 2025, covering 2024 telemetry, set the baseline:
Exploitation of public-facing applications tied with valid-credential use as the top initial-access vector, both at 30 percent of incident-response engagements in 2024.
Critical-infrastructure organizations accounted for 70 percent of all attacks IBM X-Force responded to in 2024.
Over 25 percent of those critical-infrastructure attacks were caused by vulnerability exploitation.
Four of the top ten CVEs most-mentioned on dark web forums were linked to sophisticated nation-state-aligned threat actor groups, with exploit code openly traded.
The follow-on IBM X-Force Threat Intelligence Index 2026, published February 25, 2026, goes further. Vulnerability exploitation became the leading cause of attacks, at 40 percent of the incidents X-Force observed in 2025, and attacks that began with exploitation of public-facing applications rose 44 percent year over year, driven largely by missing authentication controls and AI-assisted vulnerability discovery. IBM's separate Cost of a Data Breach Report 2026 prices the downstream impact at a record US$4.99 million global average per breach and US$11.5 million in the United States.
Microsoft Patch Tuesday: 1,130 CVEs in 2025
Microsoft's 2025 Patch Tuesday total reached 1,130 CVEs, a 12 percent increase over 2024's 1,009. This is the second consecutive year above 1,000 and the second-largest year on record, just 111 CVEs shy of 2020's all-time record of 1,245. The Microsoft Digital Defense Report 2025 places vulnerability exploitation at 17 percent of initial-access methods observed by Microsoft Incident Response, with 18 percent of breaches initiated through unpatched web assets and 12 percent through exposed remote services.
Both Microsoft datasets reinforce the same point as Mandiant and CrowdStrike: vulnerability volume is high, exploitation is fast, and edge and remote-service exposure is the single biggest patch-prioritization category.
Notable named exploitations in 2025
Six named CVEs defined the operational year. Each is verified at NVD with a corresponding KEV addition.
CitrixBleed 2 (CVE-2025-5777)
CVE-2025-5777, CVSS 9.3, is an out-of-bounds memory-read vulnerability in Citrix NetScaler ADC and Gateway. Affected configurations include Gateway and AAA virtual servers, the deployments most commonly used for enterprise remote access. Exploitation leaks session tokens (including for the nsroot administrative user), enabling session hijacking and MFA bypass without authentication. Per GreyNoise telemetry, targeted exploitation began as early as June 23, 2025, almost two weeks before the public proof-of-concept on July 4. Within weeks of public disclosure, GreyNoise observed over 11.5 million attack attempts globally. CISA added the CVE to KEV on July 10, 2025. CL0P later used CitrixBleed 2 in extortion campaigns.
Cleo Harmony / VLTrader / LexiCom (CVE-2024-50623)
CVE-2024-50623, CVSS 8.8, is an unrestricted file-upload vulnerability in Cleo's managed file transfer products. Disclosed October 28, 2024 and actively exploited from late November 2024 onward, the bug enabled CL0P to gain RCE on Cleo MFT hosts and exfiltrate data from at least 50 organizations, with CL0P's leak site claiming up to 66 victims. The most prominently named victim is Blue Yonder, the supply-chain-management vendor that powers logistics for many Fortune 500 retailers and food companies. CISA added the CVE to KEV on December 13, 2024. Cleo's initial patch was bypassed; a follow-on CVE-2024-55956 covered the remaining vector.
Ivanti Connect Secure (CVE-2025-0282 and CVE-2025-22457)
CVE-2025-0282, CVSS 9.0, is an unauthenticated stack-based buffer overflow in Ivanti Connect Secure VPN appliances. Mandiant attributed exploitation starting mid-December 2024 to UNC5221, a suspected China-nexus espionage actor previously associated with the 2023-2024 Ivanti VPN exploitation chain (CVE-2023-46805, CVE-2024-21887). UNC5221 deployed the ZIPLINE passive backdoor, THINSPOOL dropper, LIGHTWIRE web shell, and WARPWIRE credential harvester.
CVE-2025-22457, CVSS 9.8, is a stack-based buffer overflow disclosed in early 2025 and actively exploited by UNC5221 in mid-March 2025. Approximately 5,000 internet-facing Ivanti Connect Secure appliances were exposed at disclosure. UNC5221 used CVE-2025-22457 to deploy two new custom families: TRAILBLAZE (in-memory dropper using raw syscalls) and BRUSHFIRE (passive SSL/TLS-intercepting backdoor).
F5 BIG-IP (CVE-2025-53521)
CVE-2025-53521, CVSS v4.0 9.3, is a critical pre-authentication remote code execution vulnerability in F5 BIG-IP Access Policy Manager (APM). Initially disclosed October 15, 2025 as a denial-of-service flaw, F5 reclassified it as RCE on March 27, 2026. CISA added it to KEV the same day, with a 72-hour federal patching directive. The reclassification followed defused-cyber and other reports of acute scanning activity.
VMware vCenter (CVE-2024-38812 and CVE-2024-37079)
CVE-2024-38812, CVSS 9.8, is a heap-overflow in VMware vCenter Server's DCERPC implementation. Broadcom confirmed in-the-wild exploitation by November 2024, and the patch released September 17, 2024 was found incomplete and re-patched. CVE-2024-37079, also covering vCenter Server, was added to KEV in early 2026 after additional confirmed exploitation.
EPSS: probabilistic exploit prediction enters the workflow
The FIRST Exploit Prediction Scoring System (EPSS), now in v4 (released March 17, 2025), is a data-driven machine-learning model that estimates the probability a published CVE will be exploited in the wild within the next 30 days, expressed on the [0,1] scale plus a percentile. EPSS v4 hits an ROC AUC of 0.838, meaning it correctly distinguishes exploited from non-exploited CVEs about 84 percent of the time. The top 10 percent of EPSS-scored CVEs account for a disproportionate share of observed exploitation.
In 2026 the practical EPSS workflow looks like: triage by KEV first (binary, gold-standard exploited-in-the-wild signal); then by EPSS percentile (probabilistic; the top 1 to 5 percent should be patched at zero-day urgency even if not in KEV); then by CVSS only as a tiebreaker. Many vendors now expose an EPSS column directly in their vulnerability-management dashboards.
Open-source supply chain CVEs and malicious-package volume
Sonatype's 2026 State of the Software Supply Chain report recorded:
454,648 new malicious packages identified by Sonatype in 2025.
Cumulative blocked-malware total: 1.233M packages across npm, PyPI, Maven Central, NuGet, and Hugging Face.
99 percent or more of 2025 OSS malware originated on npm.
The Shai-Hulud worm compromised 500+ npm packages in days, spreading autonomously.
The IndonesianFoods campaign generated 100,000+ malicious packages, doubling total npm malware volume in days by creating one new package every seven seconds.
800+ Lazarus Group-associated packages were identified by Sonatype in 2025, 97 percent on npm.
The Synopsys / Black Duck Open Source Security and Risk Analysis Report (OSSRA), based on more than 1,000 commercial codebase audits across 17 industries, found:
74 percent of codebases contained at least one high-risk OSS vulnerability (a 54 percent jump over the prior year).
84 percent of codebases contained at least one OSS vulnerability of any severity.
Mean age of OSS vulnerabilities in codebases: more than 2.5 years.
Nearly a quarter of codebases contained vulnerabilities more than 10 years old.
The Veracode 2025 State of Software Security report, based on 1.3 million unique applications and 126.4 million raw findings, found:
Average time to fix a flaw is now 252 days, up 47 percent since 2020.
50 percent of organizations carry critical security debt: high-exploitability vulnerabilities open for more than a year.
70 percent of that critical security debt comes from third-party code (open source plus commercial dependencies).
Leading organizations fix half their flaws in 5 weeks or less; lagging organizations take more than a year.
The cross-cutting takeaway: open-source dependency risk remains the largest single contributor to enterprise application-layer vulnerability exposure, and it is now intersecting directly with malicious-package campaigns at the registry level.
Pwn2Own and ZDI: organized researcher disclosure
Trend Micro's Zero Day Initiative is one of the largest researcher-disclosure programs and the operator of Pwn2Own. Two recent events anchor the 2025 to 2026 record:
Pwn2Own Vancouver 2025: ZDI awarded more than $$315,000 total over the two-day contest, purchasing 18 different bugs across the targeted product set.
Pwn2Own Automotive 2026: a much larger event. 76 unique zero-day vulnerabilities were disclosed; researchers earned $$1,047,000 in prizes. (Trend Micro ZDI)
ZDI's broader function in 2026 is brokered disclosure: research teams sell working zero-days into ZDI, ZDI confirms and reports privately to the vendor, and the resulting CVE is published once a patch ships. This is one of the few mechanisms that closes the gap between researcher discovery and vendor patching at scale.
HackerOne: bug-bounty disclosure volume
HackerOne's 9th Annual Hacker-Powered Security Report draws on:
580,000+ validated vulnerabilities reported to date across the platform.
1,950 enterprise programs active in 2025.
$$81M paid out in bounties in 2025.
HackerOne's 2025 disclosure data also shows the AI inflection: AI vulnerability reports surged 210 percent year-over-year, with prompt injection up 540 percent, confirming AI as the fastest-growing attack surface for bug-bounty researchers. HackerOne also counted 1,121 customer programs with AI in scope in 2025, a 270 percent increase, per its October 2025 announcement.
What this means for 2026 vulnerability management
Six tactical implications fall out of the data above. None are speculative; each maps to a specific stat already cited.
1. KEV-first patch triage
CISA KEV is the highest-signal feed for prioritization. With 1,484 entries, ~24 percent Microsoft, and 19 of the 59 KEV entries whose ransomware flag flipped during 2025 targeting network-security appliances, KEV directly tells you which bugs adversaries are using right now. SLA every KEV entry on a 7-to-14-day patch cycle (federal agencies are bound by BOD 22-01 to remediate KEV CVEs on tighter timelines). Verizon's 2026 DBIR found only 26 percent of KEV entries fully remediated in 2025, down from 38 percent, so the gap between "known exploited" and "actually patched" is widening rather than closing.
2. Edge-device + VPN are the single hottest patching tier
Verizon's 8x rise in edge-device-and-VPN initial access (3 percent to 22 percent), CL0P + UNC5221 + UNC5807 targeting Citrix, Cleo, Ivanti, Fortinet, F5, and VMware, CrowdStrike's finding that 40 percent of China-nexus-exploited vulnerabilities hit edge devices, and Mandiant's observation that threat clusters are deliberately targeting boxes that lack EDR telemetry all point the same way. If you patch nothing else, patch the edge.
3. EPSS top-1-percent at zero-day urgency
The FIRST EPSS top decile concentrates a disproportionate share of real-world exploitation. Use the top 1 percent (or top 100 CVEs) as a virtual KEV-precursor. EPSS v4 ROC AUC 0.838 means the model is good enough to drive operational decisions, not a research curiosity.
4. NVD CPE matching is no longer sufficient
Per VulnCheck, NVD covered only 41 percent of 2024 CVEs with CPEs. Post-April-2026 the population covered by full NVD enrichment will drop to an estimated 15 to 20 percent. Programs that key off CPE-NVD must add a second-source enrichment feed (vendor advisories, VulnCheck NVD++, GitHub Security Advisories, OSV.dev, EPSS) or accept they will miss the majority of CVEs.
5. SLA the OSS supply-chain vector independently
Sonatype's 454,648 new malicious packages in 2025, the Shai-Hulud worm, the IndonesianFoods campaign, and the 800+ Lazarus packages are not "CVE work." They live in dependency manifests and registry metadata. Pair SCA / SBOM tooling with registry-side monitoring, and SLA dependency-related advisories on the same clock as KEV.
6. Detection over patch, on the boxes that cannot be patched fast
Mandiant's mean time to exploit is -7 days, CrowdStrike's fastest breakout is 27 seconds, exfiltration starts within 4 minutes. The patch cycle is structurally too slow to cover edge devices that take maintenance windows or attacker-friendly products that lack EDR telemetry. The mitigation is detection layered with patch: EDR/XDR coverage on every appliance that supports it, network-flow telemetry on appliances that don't (per Mandiant's UNC6201 / UNC5807 callout on edge-device targeting), and pre-staged isolation playbooks for likely zero-day-prone categories. The underlying figures are from M-Trends 2026 and the CrowdStrike 2026 Global Threat Report.
Internal references
The Stingrai research team has published companion 2026 reference posts that intersect this dataset:
Top Industries Targeted by Hackers 2026: vulnerability exposure broken out by industry, drawing on the same Verizon DBIR + IBM X-Force corpus.
Supply Chain Attack Statistics 2026: the npm + PyPI + Maven malicious-package picture in detail, including the Shai-Hulud worm and Sonatype 2026 numbers.
IoT Attack Statistics 2026: IoT-specific CVE volume and the edge-device exposure surface.
AI Cyber Attack Statistics 2026: the agentic-AI exploitation angle, including Anthropic's GTG-1002 disclosure.
Penetration Testing Statistics 2026: the engagement-side companion to this dataset, covering how often organizations test, what testing costs, and how long remediation actually takes.
For penetration-testing engagements that map directly to the exposure profile in this post (VPN, gateway, edge appliance, web application, and managed-file-transfer testing), see Stingrai PTaaS and Penetration Testing Methodologies. Stingrai is a global CREST-accredited penetration testing services company founded in Toronto, Canada in 2021, trusted by companies from startups to enterprises to meet audit requirements for SOC 2, ISO 27001, CMMC, PCI DSS and HIPAA. OSCE³, OSWE, OSEP, CREST CRT certified penetration testers, who are also world-class security researchers and bug bounty hunters. Choose from fully human-led or hybrid (AI agents plus human penetration testers) engagements across web, API, mobile, AI and LLM, cloud, network, Active Directory and social engineering penetration tests and red team engagements, with findings posted to its PTaaS portal as they are confirmed, live chat with the assigned testers, Jira and Slack integration, retesting and an attestation letter with every human-led and hybrid report. For budgeting a test against this exposure profile, see what a penetration test costs in 2026; for web-layer scope specifically, see web application penetration testing services; and for vendor selection, see the best penetration testing companies in 2026.
Aggregate counts describe the shape of the problem, but a single vulnerability is what actually causes an incident. For a worked example of one CVE from disclosure to exploitability, see our breakdown of the 2026 Redis remote code execution flaws.
Frequently asked questions
How many CVEs were published in 2025?
48,185. The total number of CVEs published in 2025 set a new single-year record, a 20.6 percent increase on 2024's 39,962. The severity split was 3,984 Critical, 15,003 High, 25,551 Medium and 1,557 Low. Cumulative CVEs since 1999 reached 308,920 by year-end, per JerryGamblin's 2025 CVE Data Review.
What is the CVSS severity distribution of 2025 CVEs?
Of the 48,185 CVEs published in 2025: 3,984 Critical (8.3 percent), 15,003 High (31.1 percent), 25,551 Medium (53.0 percent) and 1,557 Low (3.2 percent). Critical and High together account for 18,987 records, or 39.4 percent of the year. The mean CVSS base score was 6.60 and the median 6.50, per JerryGamblin's 2025 CVE Data Review. Querying NVD directly returns an incomplete picture, because only about 32 percent of CVE-2025 records had been fully enriched by April 2026.
How many vulnerabilities are in the CISA KEV catalog?
1,484 entries at the end of 2025, with 245 added during 2025 (a 20 percent year-over-year expansion). Microsoft accounts for ~24 percent of all entries (350 vulnerabilities), followed by Apple (86), Cisco (82), Adobe (76), and Google (67), per the SecurityWeek summary and Cybersecurity News breakdown.
What is the average time to exploit a vulnerability in 2026?
The mean time to exploit was estimated at negative seven days in 2025, meaning exploitation is routinely occurring before a patch is even released. The initial-access-broker handoff to a ransomware affiliate now averages 22 seconds, per Mandiant M-Trends 2026. Verizon's 2026 DBIR puts the median time to fully remediate a critical vulnerability at 43 days, up from 32 the year before, so the defensive clock is moving the wrong way.
How many zero-day vulnerabilities were exploited in the wild in 2025?
90 zero-days, per Google's Threat Intelligence Group. 2025 was higher than 2024 (78) but below the 2023 record of 100. Enterprise technology hit an all-time-high share at 48 percent (43 of 90). Microsoft (25), Google (11), Apple (8), and Cisco (4) led vendor counts.
What share of breaches involved vulnerability exploitation in 2025?
The Verizon 2026 DBIR found vulnerability exploitation in 31 percent of known initial access vectors in non-Error, non-Misuse breaches, making it the most common initial access vector, up from 20 percent in the previous edition and ahead of credential abuse, the previous leader, which fell to 13 percent. Edge-device and VPN exploitation grew nearly 8x in a single year, from 3 percent to 22 percent of initial-access cases, as first measured in the 2025 DBIR.
What changed at the National Vulnerability Database in 2026?
NIST transitioned NVD to a triage model on April 15, 2026 in response to a +263 percent surge in CVE submissions between 2020 and 2025. Approximately 29,000 backlog CVEs were reclassified as Not Scheduled, and going forward only an estimated 15 to 20 percent of incoming CVEs will receive full NVD enrichment, prioritized by KEV membership, federal-government use, and Executive Order 14028 critical-software status.
What is EPSS and should we use it?
The Exploit Prediction Scoring System is a FIRST-maintained machine-learning model that scores each CVE's probability of being exploited in the wild within 30 days. EPSS v4, released March 17, 2025, achieves an ROC AUC of 0.838. The top 10 percent of EPSS-scored CVEs concentrate a disproportionate share of observed exploitation. EPSS now belongs in the second tier of vulnerability-management triage, after CISA KEV and before raw CVSS.
Are open-source dependencies the biggest source of vulnerability risk?
For application-layer code, yes. Synopsys OSSRA found 74 percent of audited codebases contained a high-risk OSS vulnerability and the mean age of OSS vulns in production codebases is more than 2.5 years. Veracode 2025 found 70 percent of critical security debt comes from third-party code. Independently, Sonatype blocked 454,648 new malicious packages in 2025, with 99 percent or more on npm.
What were the most-exploited named CVEs in 2025?
CitrixBleed 2 (CVE-2025-5777, Citrix NetScaler), Cleo MFT (CVE-2024-50623 and CVE-2024-55956), Ivanti Connect Secure (CVE-2025-0282, CVE-2025-22457), VMware vCenter (CVE-2024-38812, CVE-2024-37079), and F5 BIG-IP APM (CVE-2025-53521). All received CISA KEV additions and confirmed in-the-wild exploitation by 2025 to early 2026.
How fast does a patch need to ship to be useful?
Faster than the patch cycle most organizations run today. With Mandiant putting mean time to exploit at -7 days, "patch within Microsoft's monthly Patch Tuesday cycle" is structurally too slow for KEV-class bugs. The defensive layer that compensates is detection: EDR/XDR on every host that supports it, network telemetry on edge devices that don't, and pre-staged isolation runbooks for high-exposure product categories (VPN gateways, file-transfer appliances, hypervisor management planes).
Put these numbers to work
Published CVE counts describe the whole internet. Your own numbers only exist once someone tests your environment. Stingrai's State of Penetration Testing 2026 shows what a real engagement finds: 93% of tests surfaced at least one High or Critical finding, with a 0.74% false-positive rate across 1,206 verified findings. If you want that view of your own environment, book a 30-minute scoping call or get a quote. Published pricing for one web application and associated APIs is US$3,000 for an Autonomous Pentest or US$6,800 for a Hybrid Pentest, on stingrai.io/pricing.
References
JerryGamblin, "2025 CVE Data Review," January 2026: https://jerrygamblin.com/2026/01/01/2025-cve-data-review/
JerryGamblin, "2024 CVE Data Review," January 2025: https://jerrygamblin.com/2025/01/05/2024-cve-data-review/
NIST, "NIST Updates NVD Operations to Address Record CVE Growth," April 2026: https://www.nist.gov/news-events/news/2026/04/nist-updates-nvd-operations-address-record-cve-growth
CISA Known Exploited Vulnerabilities Catalog: https://www.cisa.gov/known-exploited-vulnerabilities-catalog
SecurityWeek, "CISA KEV Catalog Expanded 20% in 2025": https://www.securityweek.com/cisa-kev-catalog-expanded-20-in-2025-topping-1480-entries/
Cybersecurity News, "CISA Expands KEV Catalog with 1,484 New Vulnerabilities": https://cybersecuritynews.com/cisa-expands-kev-catalog/
Mandiant M-Trends 2026: https://cloud.google.com/blog/topics/threat-intelligence/m-trends-2026
Mandiant M-Trends 2025: https://cloud.google.com/blog/topics/threat-intelligence/m-trends-2025/
Google Cloud, "Look What You Made Us Patch: 2025 Zero-Days in Review": https://cloud.google.com/blog/topics/threat-intelligence/2025-zero-day-review
Google Cloud, "Hello 0-Days, My Old Friend: A 2024 Zero-Day Exploitation Analysis": https://cloud.google.com/blog/topics/threat-intelligence/2024-zero-day-trends
Verizon 2025 DBIR Executive Summary: https://www.verizon.com/business/resources/reports/2025-dbir-executive-summary.pdf
IBM X-Force Threat Intelligence Index 2025: https://www.ibm.com/think/x-force/x-force-threat-intelligence-index-2025-attackers-steal-sell-user-identities
IBM X-Force Threat Intelligence Index 2026: https://www.ibm.com/think/x-force/threat-intelligence-index-2026-securing-identities-ai-detection-risk-management
Microsoft Digital Defense Report 2025: https://www.microsoft.com/en-us/security/security-insider/threat-landscape/microsoft-digital-defense-report-2025
Microsoft Patch Tuesday 2025 Year in Review (Tenable): https://www.tenable.com/blog/microsoft-patch-tuesday-2025-year-in-review
CrowdStrike 2026 Global Threat Report findings: https://www.crowdstrike.com/en-us/blog/crowdstrike-2026-global-threat-report-findings/
Sonatype 2026 State of the Software Supply Chain (Open Source Malware): https://www.sonatype.com/state-of-the-software-supply-chain/2026/open-source-malware
Synopsys OSSRA, 2024 announcement (covering 2023 codebases): https://news.synopsys.com/2024-02-27-New-Synopsys-Report-Finds-74-of-Codebases-Contained-High-Risk-Open-Source-Vulnerabilities,-Surging-54-Since-Last-Year
Veracode 2025 State of Software Security: https://www.veracode.com/resources/analyst-reports/state-of-software-security-2025/
Veracode security-debt press release: https://www.businesswire.com/news/home/20250227022178/en/Veracode-Reveals-Half-of-Organizations-Burdened-by-Critical-Security-Debt-with-70-Stemming-from-Third-party-Code-and-the-Software-Supply-Chain
Trend Micro Zero Day Initiative, Pwn2Own: https://www.trendmicro.com/en_us/zero-day-initiative/pwn2own.html
Trend Micro ZDI, "Pwn2Own: Researchers Earn $1 Million for 76 Zero-Days": https://www.trendmicro.com/en_us/research/26/a/pwn2own-researchers-earn-1-million-for-76-zero-days.html
FIRST EPSS Special Interest Group: https://www.first.org/epss/
FIRST EPSS Model documentation: https://www.first.org/epss/model
VulnCheck, "Danger is Still Lurking in the NVD Backlog": https://www.vulncheck.com/blog/nvd-backlog-exploitation-lurking
VulnCheck, "Enhancing Access to NIST NVD data": https://www.vulncheck.com/blog/nvd-cpe
CSA Lab Space, "NVD Enrichment Triage": https://labs.cloudsecurityalliance.org/research/csa-research-note-nist-nvd-enrichment-policy-change-20260419/
Vulnerability Blog, "2024 CVEs in Review": https://vulnerability.blog/2025/01/14/2024-cves-in-review/
HackerOne 9th Annual Hacker-Powered Security Report: https://www.hackerone.com/report/hacker-powered-security
HackerOne, "AI Vulnerability Reports +210%": https://www.hackerone.com/press-release/hackerone-report-finds-210-spike-ai-vulnerability-reports-amid-rise-ai-autonomy
CitrixBleed 2 (CVE-2025-5777) NVD entry: https://nvd.nist.gov/vuln/detail/CVE-2025-5777
Tenable, "CVE-2025-5777 / CVE-2025-6543 FAQ": https://www.tenable.com/blog/cve-2025-5777-cve-2025-6543-frequently-asked-questions-about-citrixbleed-2
SOCRadar, CitrixBleed 2 NetScaler analysis: https://socradar.io/blog/cve-2025-5777-citrixbleed-2-netscaler-gateway-devices/
Cleo CVE-2024-50623 NVD entry: https://nvd.nist.gov/vuln/detail/CVE-2024-50623
Mandiant, "Ivanti Connect Secure VPN Targeted in New Zero-Day Exploitation": https://cloud.google.com/blog/topics/threat-intelligence/ivanti-connect-secure-vpn-zero-day
Mandiant, "Suspected China-Nexus Threat Actor Actively Exploiting Critical Ivanti Vulnerability": https://cloud.google.com/blog/topics/threat-intelligence/china-nexus-exploiting-critical-ivanti-vulnerability
The Hacker News, "CISA Adds CVE-2025-53521 to KEV": https://thehackernews.com/2026/03/cisa-adds-cve-2025-53521-to-kev-after.html
Censys, "VMware vCenter Server Vulnerabilities Actively Exploited": https://censys.com/advisory/cve-2024-38813/
Scott Moore, CNA Distribution Tracker: https://scottmoore.net/cna-ranking/index.html
YesWeHack, "CVE Surge: Why the Record Rise": https://www.yeswehack.com/news/cve-surge-record-jump-vulnerabilities
Verizon 2026 Data Breach Investigations Report: https://www.verizon.com/business/resources/reports/dbir/
Verizon 2026 DBIR Executive Summary (PDF): https://www.verizon.com/business/resources/reports/2026-dbir-executive-summary.pdf
GreyNoise, "The Noise in the Silence: Unmasking CISA's Hidden KEV Ransomware Updates": https://www.greynoise.io/blog/unmasking-cisas-hidden-kev-ransomware-updates
IBM Cost of a Data Breach Report 2026: https://www.ibm.com/reports/data-breach
CrowdStrike, "2026 CrowdStrike Global Threat Report" (press release): https://www.crowdstrike.com/en-us/press-releases/2026-crowdstrike-global-threat-report/
MIT Technology Review, "Cybersecurity's global alarm system is breaking down": https://www.technologyreview.com/2025/07/11/1119370/cybersecurity-alarm-system-breaking-down/
NIST National Vulnerability Database Dashboard: https://nvd.nist.gov/general/nvd-dashboard
Related reading
Choosing a penetration testing provider in North America? Start with these guides: